Most experienced autocrossers think that, all else equal, a smaller, slower radius takes less time than a larger, faster radius. You know that, right? Are you sure? Let’s make sure and find out exactly how much time we’re talking about.
The figure below shows one typical autocross situation, a slow 180 degree turn-around. Let’s assume the car is 6′ wide, corners at 1G and the cones create an 40′ inside radius with a path width of the SCCA minimum 15′. So, the center of the car travels on a 40+3=43′ radius on the red circle and a (40+15)-3=52′ radius on the green path. I won’t bore you with the math, but at 1G the car on the red path travels at 25.4 mph while the same car on the green path travels at 27.9 mph.
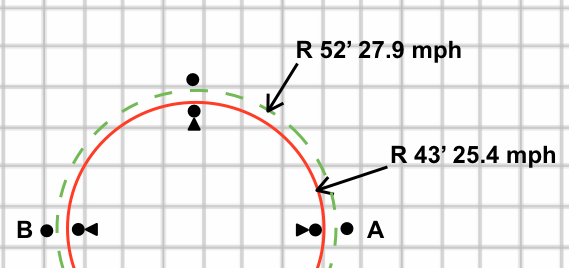
Given this is a 180 degree turn-around, we are interested in the time difference if we enter at A and exit at B. Once again I won’t bore you with the math. The inner, red path saves 0.37 seconds over the green path. The total time for the outer path is only 4.0 seconds, so the difference is almost 10%.
Hey, you were right!
Why is this? Because the length of the path increases faster than the speed. The red path is 135.1′ while the green path is 163.4′. So, the path distanced increased 21% while the velocity only increased 10%.
Now, if the course designer gave you extra room, and you were foolish enough to take it, you’d lose even more time. For instance, just 10′ more radius allows the car to increase speed to 30.4 mph and add another .37 seconds to the time from A to B.
Another way of looking at this: You know a tighter radius is better, but by mistake you enter the turn-around 5 mph too fast. (30.4 – 25.4 = 5)
You just lost three quarters of a second in this one feature. That’s called “forever” in autocross. Still want to wait to the last possible second to hit the brakes?