Some may know that I’ve been compiling a rating system for autocross cars for several years. It’s aimed primarily at A-Street and B-Street. Below is the list of BS cars for which I’ve run the numbers.
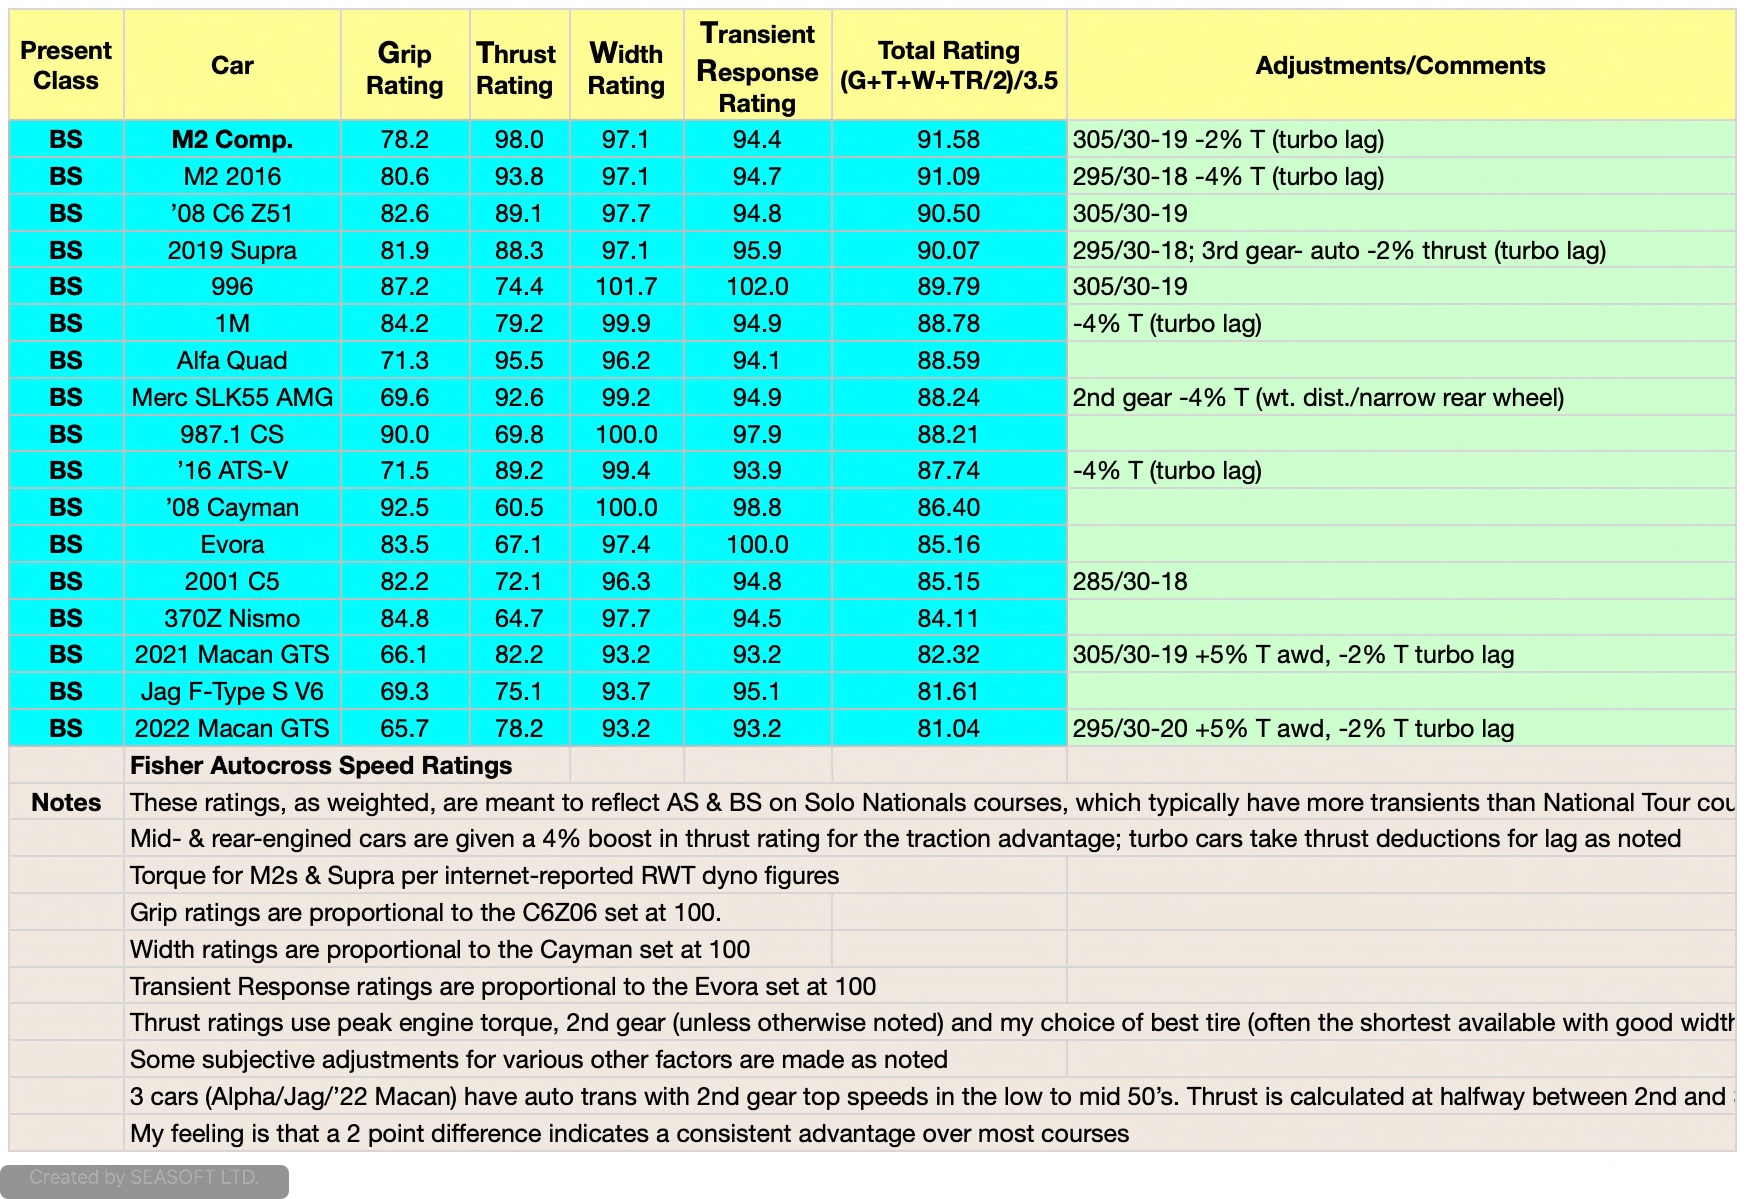
I calculate four individual Ratings which are then combined per the formula shown in the Total Rating box. First is Grip. This is very simple: weight of the car (with a 200lb driver) divided by the sum of one front and one rear rim width. So, for instance, it might be 3200 pounds divided by 9″ + 10″ which is 3200/19 = 168 pounds per inch of rim width.
Then I normalize all the resulting grip rating numbers for all the cars. This means I pick some car (originally the best one) and make its value equal to 100 and proportionally adjust all the others to suit. Of course, when it comes to grip, less weight per inch of rim is better, so it gets inverted.
You may be asking why there is no car in BS with a grip rating of 100. This is because the C6Z06 in AS got the 100. If you look at the list you can immediately see that none of these cars in BS comes close to the 100 Grip score of the C6Z06. Now you know the basic reason why the C6Z06 is so fast on an autocross course!
A rating value can be over 100. I typically don’t go back and re-normalize everything when a new car is better in some respect than the original car I set at 100. This means that the Total Rating is no longer strictly a 100 point scale. Maybe I’ll go back and change that.
I would love to be able to use center of gravity height in my rating system for evaluating Grip. Unfortunately, that’s not a number that is often published for most cars.
Once I have the individual Ratings, I create a combined Total Rating. Grip, Width and Thrust numbers are added in equally. Transient Response is weighted at only 50% compared to the other three. All of this, while based on numbers, is still, in the end, only a partially objective way of evaluating autocross speed. You will have to decide for yourself how accurate you think it is.
I show the individual Ratings for a reason: it allows you to combine them differently. If you think Grip is 25% more important than Thrust you can revise the total and get your own answer.
I recognize that there are many intangibles in autocross performance that can’t be put into such a system. Some subjective adjustments have already been made and are explained on the chart. For instance, it wasn’t until I autocrossed a 2019 Cayman GTS that I realized how detrimental turbo-lag can be even in a modern car with the latest-design variable-geometry turbo in certain types of autocross features. I penalize the M2C less than the M2 for turbo lag based on the faster-spooling system in the M2C which people have praised as significant over the original M2. In reality it’s very course dependent. In a course with nothing but standard corners linked by short straights turbo lag is almost a non-factor. This is because we do not require instant full torque at the apex of a standard corner. We only require a smaller amount of torque to be ramped up as we open the wheel. But in many linked features we can use instant torque for a very brief time. That’s when we get nothing, or worse than nothing, from a turbo engine.
For the Thrust rating I calculate the theoretical acceleration at peak torque in 2nd gear, unless otherwise noted. To do this I use the weight of the car plus 200 lbs for the driver, 88% of the manufacturer’s rated peak torque (to account for drivetrain losses), 2nd gear and final drive ratios and the rear tire diameter. The proper rear tire diameter is something I spend a lot of time figuring out. I don’t use what came on the car. I find what I think is the best (usually smallest diameter) wide, 200TW tire that’s legal to use on that car. I assume the owner will spend the money on custom wheels if necessary. This often has a significant effect on the ratings.
This Thrust rating is representative of the acceleration performance but clearly does not tell the whole story. Yes, it would be better to integrate the total acceleration from, say, 30 mph to 65 mph using dyno graphs. I simply don’t have the time to collect and process all that data so I leave it to others.
Width is a straight-up comparison using the manufacturer’s stated width, not counting mirrors. I do not go around measuring the actual width on the ground at the rear tires of cars at autocross events. I’d probably get run over.
The Transient Response rating is, well, it’s a little complicated. To my knowledge I’m the first to calculate such an estimated number from internet-available data. I received an inquiry from the SCCA as to how I do it. (I told them.) It’s clearly only an estimate of a very complicated property, but the key thing I came to understand is this: when a car begins the transition from going straight to turning it does not rotate about the center of gravity of the mass, i.e. it does not rotate about the middle of the car. Instead, the initial motion is a rotation about a point somewhere behind the rear bumper for almost all vehicles. Therefore, the initial resistance to that rotation is the inertia about that point, which is located at a percentage of the distance from the rear axle to the CG behind the real axle. Got that? So, I estimate the mass moment of inertia around that point. As the car transitions into the turn the center of rotation moves forward.
This means that the polar moment of inertia value, a property at the CG point and so often bandied about, is a poor gauge of Transient Response. Polar moment mostly tells you how fast the car rotates once already spinning, not how fast a car transitions. Even once fully into carving a turn the rate of rotation about the center of the car is low. A car only rotates once per full revolution around a driven circle, say, a 200 foot skidpad, which requires multiple seconds to negotiate. But the initial turn rate about the initial rotation point behind the rear bumper is very fast and substantially limited by the inertia around that point.
Also of next to no importance is the peak turn rate in degrees per second that a car eventually reaches at the end of the standard step-steer test, a mistake some people (Car and Driver, for one, in their Mid- vs Rear-Engine Debate in 2011) have made. You may notice that the 996, recently moved down from AS to BS, is the only car with a higher Transient Response rating than the Evora, which had previously been the 100 point standard, and which in turn has a higher rating than the Cayman. The Evora, while mid-engined like the Cayman, rates higher because it has more rear-weight bias than the Cayman. Lotus knew exactly what they were doing in designing a car that’s almost universally praised as better handling than the Cayman.
The 996 rates higher than the Evora because it has a shorter wheelbase (even shorter than the Cayman) and even more rearward weight bias, both of which tend to reduce the moment of inertia around the point of initial rotation. 911s have always been more “nimble” than Caymans in spite of having more weight and a higher polar moment of inertia. Car and Driver was unable to figure this out.
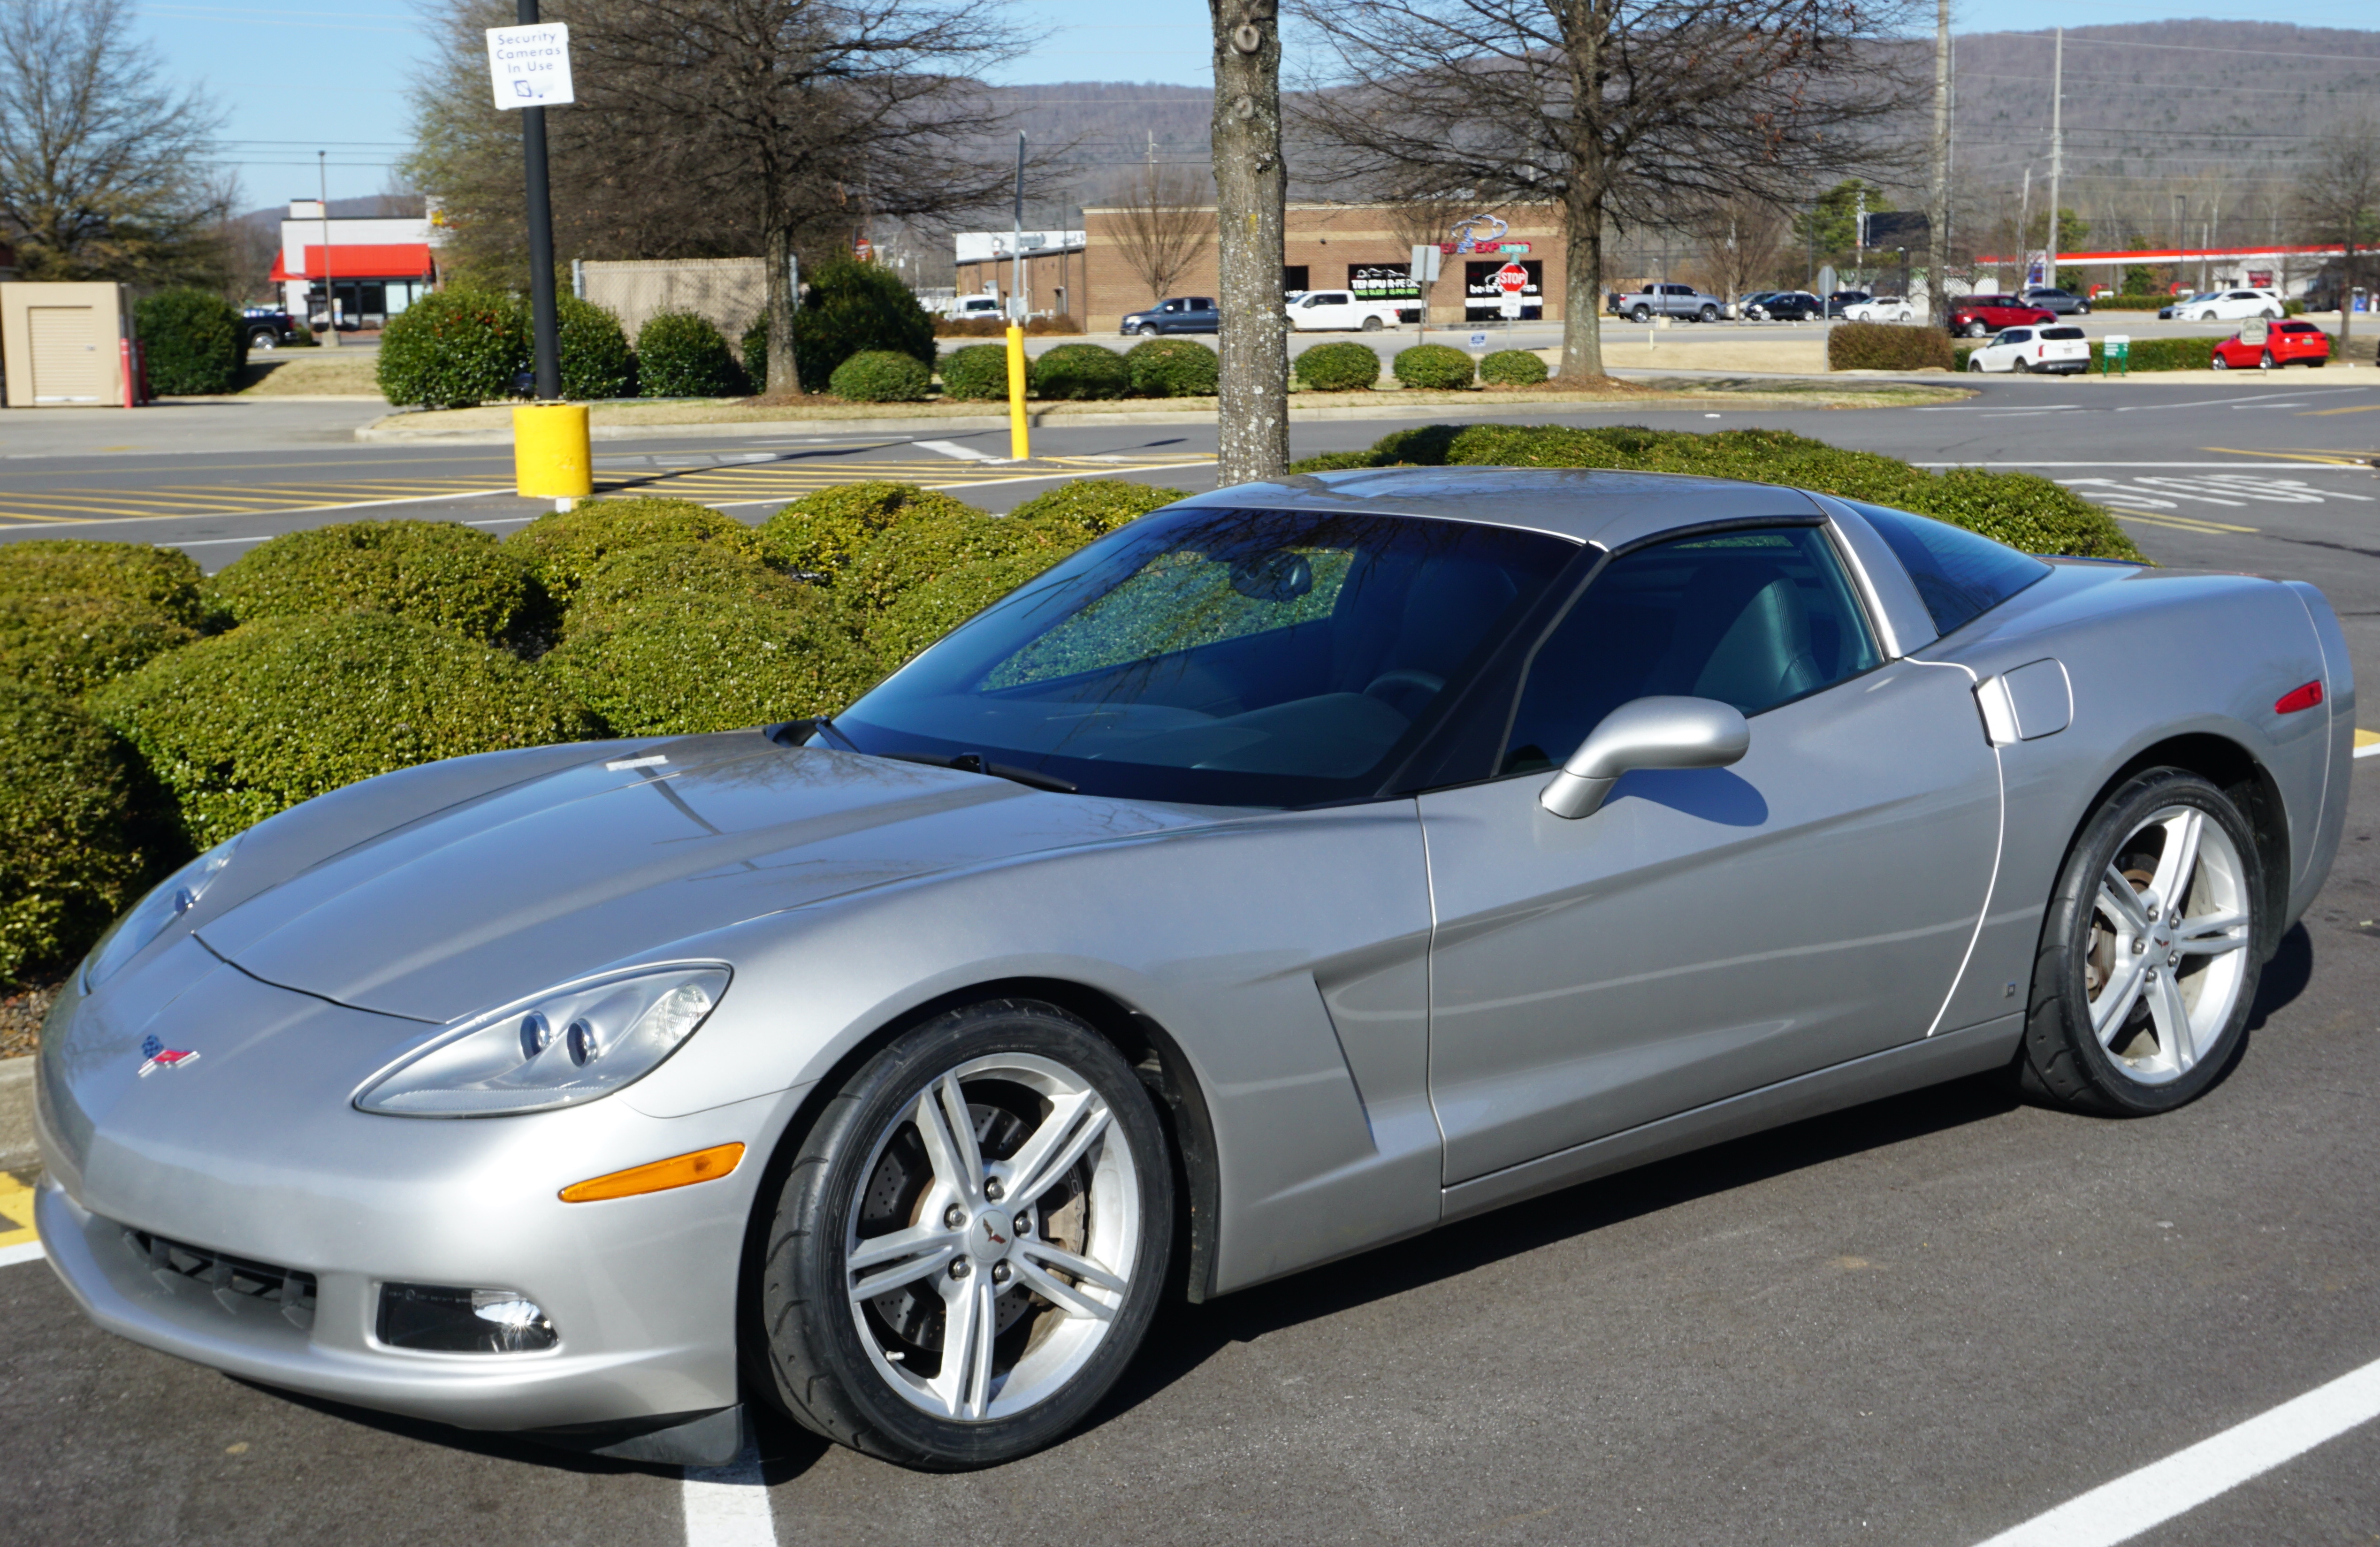
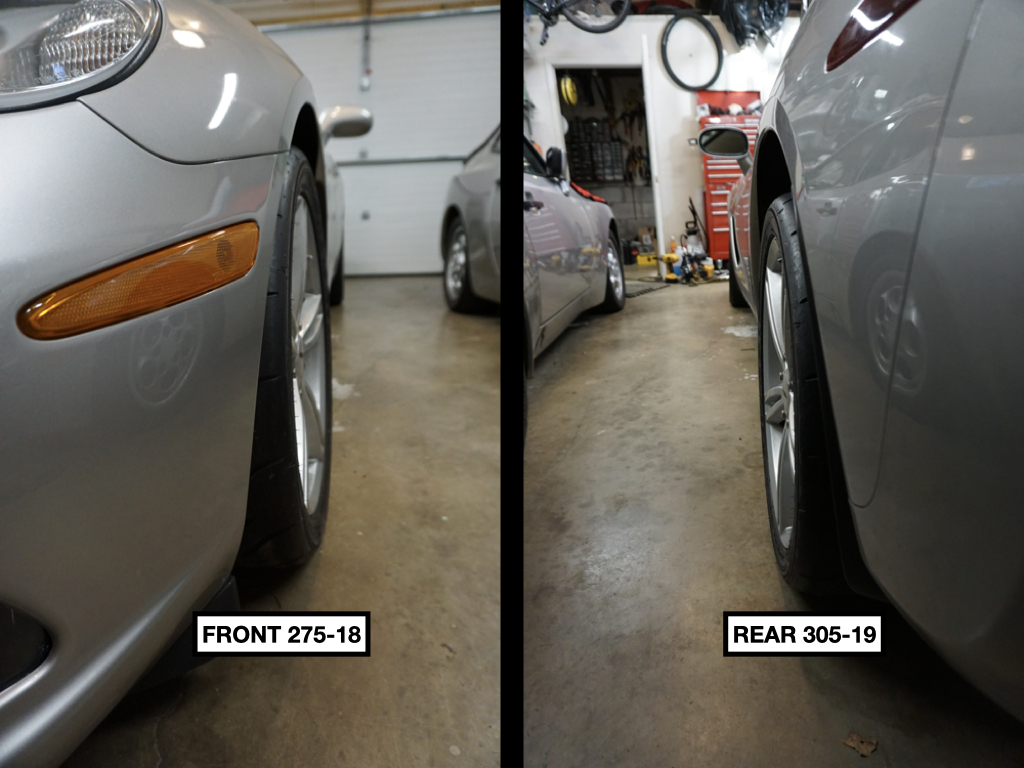
Silver Ghost, my C6Z51, is third on the Ratings list, a full point behind the M2C and half a point in front of the Supra. (Note that I think it requires about a two point difference to indicate a consistent advantage, so I think these cars are really very similar in autocross speed.) I’ve used the 305/30-19 Falken as the tire when calculating the Thrust Rating for Silver Ghost. If it turns out that it is possible to use an 18″ tire (ABS issues and availability of a properly small diameter front tire seemingly block its use) the Thrust rating will increase enough to vault the C6Z51 right up there with the M2C. Please note that these calculations necessarily assume that every car can employ every bit of torque produced by the engine at all times, whether or not they have an LSD, enough tire with enough weight on it or a sufficient suspension setup to actually do so. That assumption is clearly not always true.
I took a look at recent, same-day, same-equipment, dyno results comparing the 2022 Supra to the older ones. It’s clear that it has more peak power… significantly more, and in recent BMW fashion the car continues to be seriously underrated as compared to other manufacturers. However, the peak torque, which occurs at a very low RPM, is essentially unchanged. Boost is apparently increased only in the top half of the rev range. Therefore, the Thrust Rating for the 2022 model wouldn’t change much, if any.
If you have questions or want to know more details of how the Ratings are calculated leave me a comment and I’ll do my best to explain. As always, feel free to tell me where I’ve gone off the rails.