The course at our last event of the season had an interesting more-than-180 degree sweeping turnaround. Partly by design and partly by not being overly consistent I got data on three different approaches to the corner.
The three afternoon runs are shown in Figure 1, below. Run 1 is green, run 2 is blue and run 3 is red. The day was sunny but cool. The tires definitely got better (warmer) from 1 to 3, which partially determined the changing approaches, but I had already planned to use this corner as a data-analysis opportunity.
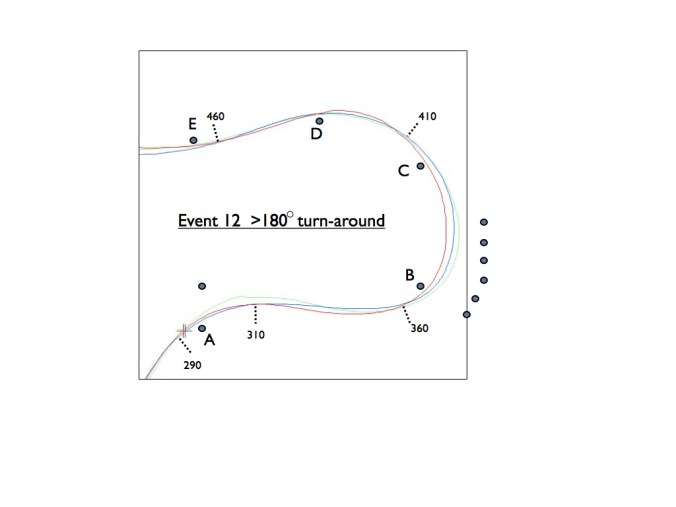
Figure 1 Turn-around
Here was the plan: Run 1, green, was to be the “momentum maintenance” line. Green would enter the corner beyond cone A faster, via less braking, attempting to carry more speed from the fast section that preceded, even though it would mean a bigger turning arc beyond cone A. Green would continue turning right about half-way down to B to get a good angle when turning back on that cone, again braking as little as possible.
Beyond B Green would take a wider path to get the best possible angle on cone D, not worrying about keeping close to cone C. A good angle on cone D would allow early power application for the following acceleration zone.
Run 2, Blue, was intended to make maximum use of the short acceleration zone between A and B. To do this, the plan was to execute a little more braking on the approach to A and open the steering wheel earlier for the earliest possible application of power. Blue would accelerate for as long as possible and sacrifice some angle on cone B, accepting that the car will go deeper beyond B.
Going deeper beyond B was not necessarily such a bad thing as it would allow a good angle on cone D, just like Green.
Run 3, Red, was planned to be the tightest, minimum distance path from B to D. Red would slow enough before A to allow some acceleration down to B and then get wide enough to cut in at B to cross from B to D by a tight path that was close to cone C.
Cutting a shallow, fast line across from the two cones that form the entrance and exit to a 180 degree turnaround is a strategy I’ve used on larger 180’s at certain national events. It’s only good if the exit cone is not constrained by needing to be backsided. That is, the line must be open beyond that cone so that significant braking for that cone is not required. This was not the case for this particular section.
Which path do you think saved the most time? Or, would you have done something different? Before you decide, I’ll give you some data to think about.
The relative path distances: From A to E the green path is 439 feet, Blue is 428 feet and Red is 425 feet. So, Red was the shortest path, but only by three feet as compared to Blue. As expected, Green was the longest path, 11 feet farther than Blue, 14 feet farther than Red.
Entry speeds: At A, Green is moving 41.6mph, having braked less per the plan. Blue is at 38.1 and Red is at 39.8. There’s no real reason for Blue to be slower than Red. Chalk it up to driver inconsistency and maybe cooler tires.
Maximum speeds between A and B: 41.7mph for Green, i.e. essentially no difference from the entry speed. This makes sense because Green is supposed to be turning smoothly at max lateral g at all times.
Red has managed to accelerate a bit from 39.8 to 42.3mph.
Blue, which had the slowest entry at 38.1mph, gets up to the fastest at 43.9mph, as intended. Of course, if Blue had entered as fast as Red it would have reached an even higher speed.
The path distances and speeds indicate to me that the three runs were driven basically according to plan. The only anomaly is that Red’s entrance speed is a little faster than Blue when it should be, by all rights, a little slower. I was probably driving more aggressively on the warmer times for the Red run. This gives an unfair edge to Red.
So, what actually happened as far as time lost or saved? The Delta-T chart tells the tale in Figure 2, below.
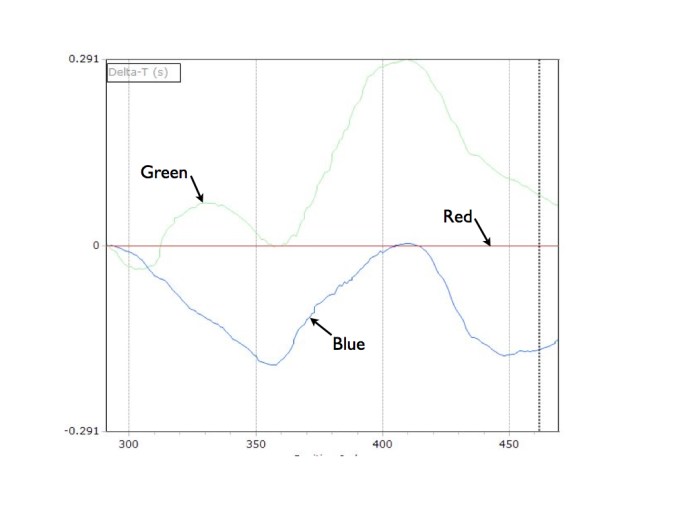
Figure 2 Delta-Time
Now, Red was the fastest run overall, so the software has set it as the baseline. It’s a completely flat line. The time difference for the other two runs appear as lines that waver around the red line. When the Green and Blue lines are descending they’re gaining time on Red. When ascending they’re losing time to Red.
From Position 290 to 460 Blue has saved 0.16s over Red. Red has saved 0.08s as compared to Green. But, as you can see, it’s not quite that simple.
Green is catching Red as the data ends and by the time the cars get to the next cone (not shown) Green equals Red. Why? Because the better angle that Green had on cone D allows it to pass D faster and maintain a speed advantage over Red from then on. Blue maintains an advantage over Green, however, having rounded cone D just about as well.
To fully understand what happened we need to separate the story into two parts: before B and after B.
Before B, at Position 360, Blue has pulled a lead of 0.19s on Red. Green initially had a speed advantage on Red and Blue around the cone at B as seen at Position 300, but then loses it due to a longer path and inability to maintain that speed. The relative speeds can be seen in Figure 3, below.

Figure 3 Speed
Paradoxically, Green catches Red by Position Index 360. (See Figure 2) It does this by braking less than both Blue and Red as the cone at B is approached. This is the great advantage of the momentum-maintenance mindset: you can really focus on carrying speed and staying off the brakes, which spurs you to take corners faster than you think you can.
Beyond Position 360 we have a give-it-up-to-gain-later situation. Red, the tight path, initially makes up tremendous ground on both Green and Blue, leading Green by 0.29s at Position 410 (and even slightly leading Blue), by virtue of the shorter path, a higher minimum cornering speed (about position 370 in Figure 3) and by a consistently higher speed from 370 to 400.
Red loses everything by cone D, however, having to slow tremendously to get tightly around that cone. Even with slowing a full 6 mph as compared to Blue at D, Red still pushes out a little wider than optimum, pulling a 1.34 lateral g shock at D in an attempt to limit the damage, as seen in the Lateral-g chart in Figure 4, below.

Figure 4 Lateral g
Red is royally screwed for the entire next section of the course and both Green and Blue claw back most of the advantage they had previously at Position 360.
Conclusions
1.Maximizing the acceleration and speed from A to B as done by Blue was a good strategy, especially for a relatively powerful car.
2. The big hump in Blue’s delta-T trace centered at Position 410 in Figure 2, indicates that Reds strategy of a flat, fast path across the 180 turn was equal to Blue’s line in the 180 itself. Blue had gained earlier and Blue maintains that lead after cone D, so Red was not the optimum line overall, but might have been if the next feature after cone D had not been as constraining.
3. Given that this feature required more than 180 degrees of turning, ignoring the cone at C and taking a wider path from B to D was necessary to get a proper angle on cone D. This allowed early acceleration from a higher starting speed as the course straightened. Even though Red had warmer tires and was able to accelerate harder than both Green and Blue, it couldn’t catch up beyond cone D. This was a true (and rare) instance of the value of a “late-apex” in the road-race sense thanks to a severely decreasing radius path dumping into an acceleration zone.
