Just back from Wilmington, Ohio where I ran the Spring Pro-Solo. Great event with the usual close competition and great competitors in B-Street. This was my 3rd Pro-Solo, spread out over a 4-year period, and first Pro-Solo trophy, 3rd place.
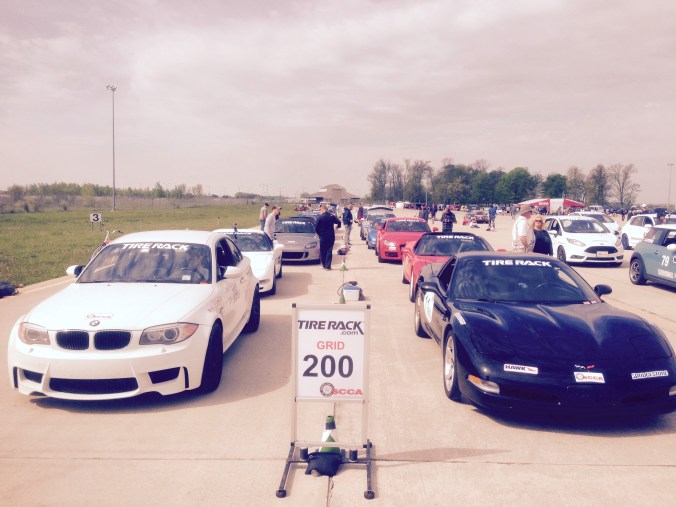
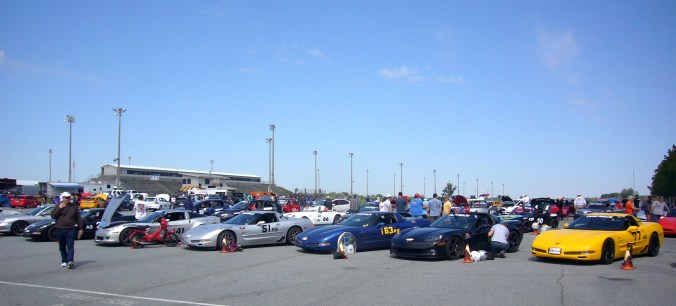
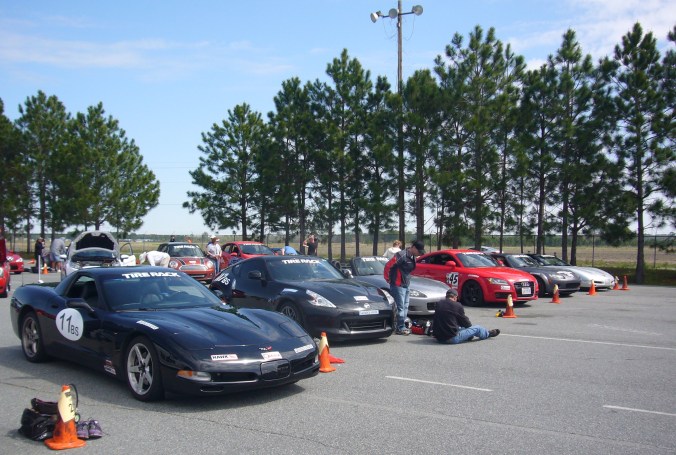
Fig 1- B-Street Class at 2016 Wilmington Spring Pro-Solo
If you don’t know about Pro-Solo, it starts with a short drag-race between two cars lined up side by side. After 150 feet or so of full-throttle acceleration the cars peel off in opposite directions into mirror-image autocross courses. After the finish, the two cars cross over to the other lane and run the other side, again with a drag-race start. Then you swap sides two more times. Very, very intense.
The “amateur” or “old” drag race light-tree is used: a white light indicates the car is properly staged, then three yellow lights illuminate in sequence leading to the green go-light. The idea is to get in sync with the lights, learning when and how to launch, so that everyone leaves more or less at the same time, but no earlier than 0.500s after the green light. (0.500s is theoretically about the typical human reaction time to any signal.) Otherwise, people would simply guess the green light, most runs would be early and red-lighted (disqualified) and the winner would be the lucky one who managed to go right on the green without being early.
With the light-tree skill and experience are required to match your start time and technique with the car to get an on-time start (low, but not too low, reaction time) and best acceleration. Too much wheelspin and you’ll be slow, even if you started at the right time. Bog the motor and you’ll also be slow. Reaction time and time to cover the first 60 feet is recorded so you can analyze how good you’re doing. Any reaction time less than 0.500s (called a 500 light) results in a red-light and disqualification of that run. A good 60 foot time might be in the range of 1.9s for a car like mine when the start area has rubbered-in… I got one of those. A more normal 60 foot time for me was in the range 2.1s to 2.2s, so significant room for improvement exists. Too much wheel-spin at launch is my typical issue.
Each heat consists of four runs, two on each side of the course. Your final time is the best run on each side added together over three rounds, two rounds on Saturday and the third on Sunday. Three rounds times four runs per round equals 12 runs total, six on each side to determine the class winner.
Pro-Solo courses are typically shorter and faster than standard Solo courses, sometimes even less than 30 seconds if the area is small. These courses were 36+ seconds for B-Street and a bit unusual in that each side contained two very sharp, slow corners. These sharp corners were clear examples of age-discrimination. Both were more than 90 degrees, the second being a turn of an estimated 130 degrees. Many of the over-60 crowd (like me) can’t turn their head that far! I smell class-action lawsuit. (Just kidding, Mr. Herbst, course designer!) The options for taking that sharp corner are the main subject of this post.
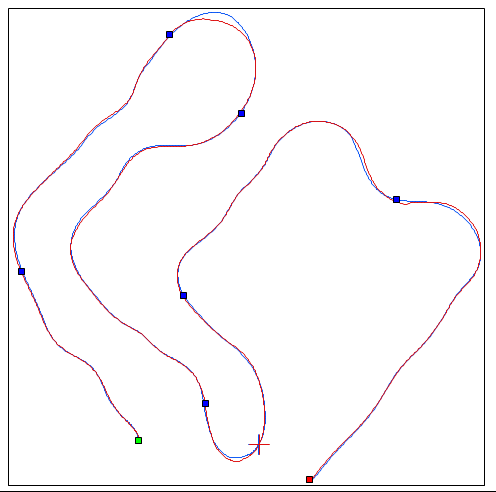
A path plot from my data is shown in the figure below. This is only the left side course and the green start dot is placed near the end of the drag-race section, just before turning left into the autocross course. At that point the car is moving 30+ mph.
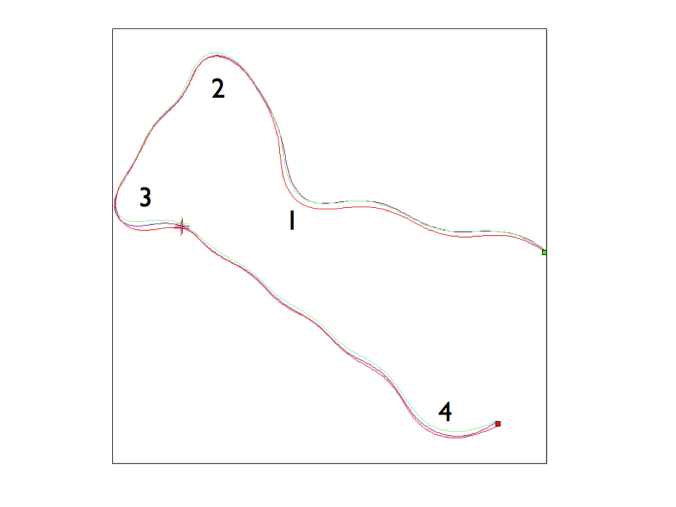
Fig. 2- 2016 Wilmington Spring Pro-Solo Left Side Data Paths
The plot shows three paths, one from each of the three rounds. There may be a little bit of GPS drift evident, but not enough to ruin the comparison. Light green is the best run from the 1st round, purple is from the 2nd round and red is the best run from the 3rd round.
I’ve marked the key turns as 1, 2, 3 and 4. Turns 2 and 3 were the sharp, slow corners I mentioned earlier. Turn 4 continued into the finish lights, so if you did it right, you never did get back straight until after the lights. Lots of fun testing your resolve and ability to control the car as you exited the 50+ mph, 7-cone slalom and negotiated this turn. After walking the course my plan was to stay tight, tight and tight on turns 1, 2 and 3. Sometimes I pushed out by mistake (entering too fast), but the plan was to stay very tight. In fact, the wide green path in corner 2 is a push-out caused by entering too fast. Later runs I fixed that.
After analysing data Saturday night, I changed the plan to: flow-thru 1, maintaining more speed and not trying to be close to the second cone that defined this sweeper, stay tight on 2, and not quite as tight as before on 3. My idea was that the entrance to the slalom after turn 3 is slow and short and therefore, 1) wouldn’t be much affected by more turning to get into it, and 2) didn’t afford enough of an acceleration zone to be worthwhile, especially starting from such slow car and engine speeds.
Not over-braking and flowing thru 1 to maintain more speed and engine rpms saved time down to turn 2 as compared to a tighter and shorter path… about 0.2 seconds. This should have saved time on both sides Sunday, but I red-lighted an otherwise mistake-free run on the right side, so I lost that improvement.
Staying tight and short around 2 was clearly correct. I had several different paths, due to mistakes, to compare one to another. I kept doing it as tight as I could on Sunday.
How tight was right around turn 3? That’s the question we are going to explore with the data. Turns out my first plan was best, but not by much. Though it certainly felt better to go faster around that corner, and was not any further distance, it didn’t quite pay off like I thought it would.
The figure below is a closeup of turn 3. It shows tight (green), not quite so tight (purple) which was a failed attempt to stay tight, and significantly wider and faster (red), which was done on purpose…
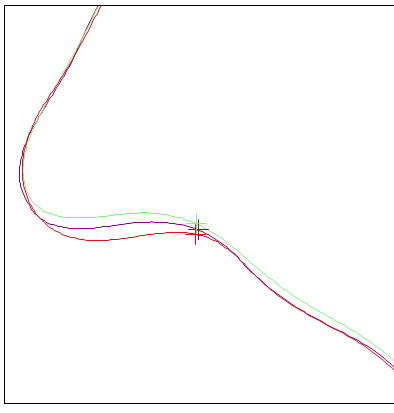
Fig. 3- Wilmington Sharp Turn 3
… and here is what that corner looked like in reality:
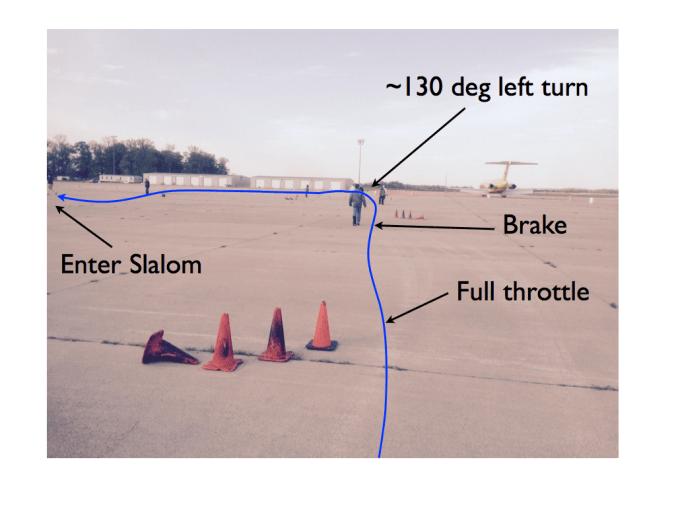
Fig. 4- Approaching Turn 3
You approach at full throttle, figure out where to brake and what speed to brake down to, turn about 130 degrees and then accelerate while curving back to the right into the entrance to a long slalom.
The choice was this: whether to maintain the corner super-tight, which is almost always best, plus it gave a better entry to the slalom, or maintain more speed with a bigger arc, which takes a more direct path to the first slalom cone, but then sacrifice the slalom entry angle and acceleration to some extent. Because of the rather unique geometry of this corner as it led into the slalom, the various paths were all about the same total distance, so we can neglect distance effects. What does the data say? Here it is:

Figure 5- Turn 3 Data
The 340 position index is about the braking point. The LongAcc curves are all very negative by 350, indicating heavy braking. Looking at the top Speed trace you can see (if there were more gradation marks) that the minimum speed for the tight, green path is 22 mph, the next slowest is the purple path at 24.5 mph and the faster red path slowed only to 28.4 mph. So, we have three instances with different speeds around this corner and quite different paths.
Right of the vertical cursor line (set at 440 Position Index) on the Speed graph we see that the green path is higher (faster) than the others. The cursor is located where the green LongAcc trace turns positive, indicating acceleration. That’s one advantage of the tighter green path: it gets back on the gas earlier. In this case, that was made possible by starting from a lower speed.
Of course, what we really want to know is the time saved. This is shown in the DELTA-T traces on the bottom. The red path has been chosen as the baseline, so it stays flat while the other two fluctuate around it. We see that both the green and purple traces lose significant time during the corner, as much as .37 seconds. The time saved by the red path is 0.3s or more compared to the other two all the way out to the where the cursor is located, which is about where I begin to turn around the first slalom cone in each case. If we stopped our investigation at this point it would appear that the wider, red path saved significant time. The issue becomes clouded with what happens next, however.
Both wider paths have to continue turning longer in order to get around the first of the 7 slalom cones. The purple path almost, but not quite, makes up all the time lost to the red path by the time the car is half-way to the 2nd slalom cone. In fact, it might have made up all the time except for a drop-out in acceleration that’s evident in the LongAcc trace at about 465 Index. Probably the rear tires slipped out a bit.
By the end of the data trace the green path has saved almost 0.1s as compared to the red path. This isn’t a lot, but there are some other facts we must consider:
1) the grip was the least during the first round (green trace) and best during the 3rd round (red trace). So, if I’d continued to always take the tight path the time saved by the tight path probably would have been a little more because the cornering speed would have been higher at the same tight radius.
2) a significant slow down is evident in the red Speed trace at the 450 position index. The car slows back down to 28.5 mph a second time in order to negotiate the first slalom cone turn, which is sharper due to being “out of position.” This is what really hurt the wider, faster red path.
Conclusions: for my car, with its particular grip and acceleration characteristics, it didn’t much matter how I took this turn! There’s hardly any difference in the Delta-T once you take the first part of the slalom into account. What appeared at the time to be better, namely a wider, faster turn with a more direct path to the slalom did not actually save any time. On the other hand, it appears to have cost only a very small amount.
What about for other classes and cars? Well, a faster accelerating car would gain more accelerating into the slalom. So, tighter would have definitely been better. A weakly accelerating car might very well have saved time by not staying super tight and maintaining more speed, more like the red path.