After the big error discussed in Part 2 of this series, I got mad, got fast and made up some time. Then, it happened again!
Recall that this is what the course looks like from the GPS data, with sectors designated by dots. Run 1 is in blue, Run 3, overall slightly faster, is in red.
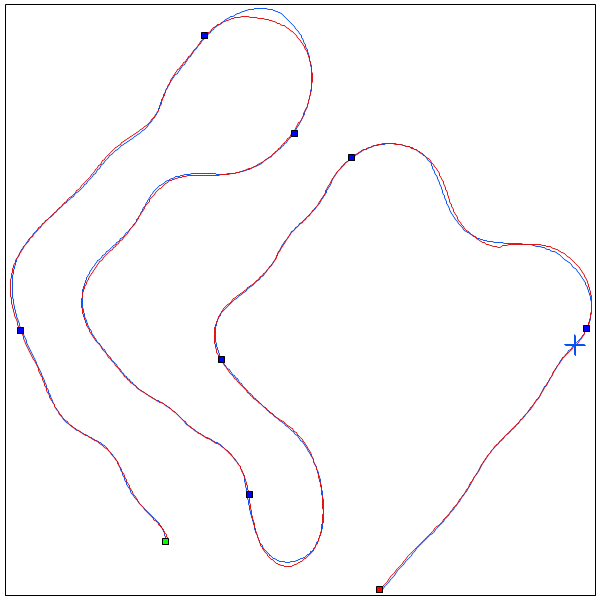
Fig. 1 Overall Course Day 1
I want to focus now on the revised seventh segment from the start (green dot), which is the one preceding the cross-hairs, i.e. the last one before the finish segment.
A closeup of segment 7 looks like this. It contains three sweeping corners.
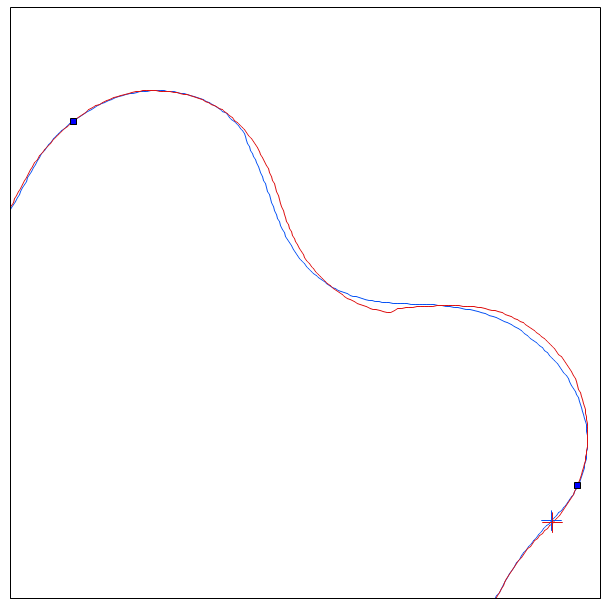
Fig. 2 Segment 7 Close-up
Right off we can see significant differences between the two tracks. There even appears to be a kink in the red path, Run 3. Uh-oh! That’s probably not good.
Let’s look at the graphical data. This next figure shows Speed at the top, then LatAcc (cornering force), Delta-T(ime) and finally LongAcc (gaining & losing forward speed.) Recall that for Delta-T the flat red line indicates the red run and the blue line indicates the time lost or gained in comparison to the red. Notice the wide swing from positive to negative and back to zero.
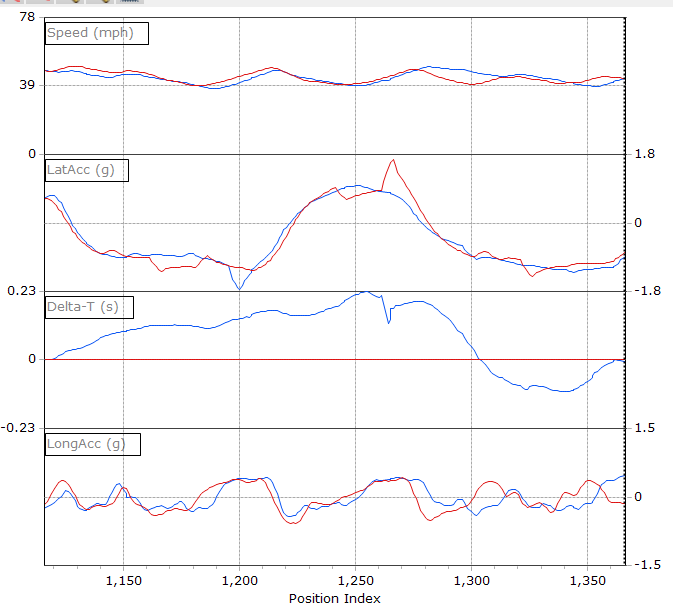
Fig. 3 Graphical Data for Segment 7
I’ve put some indicator numbers on the graph so we can talk about what I see one by one.
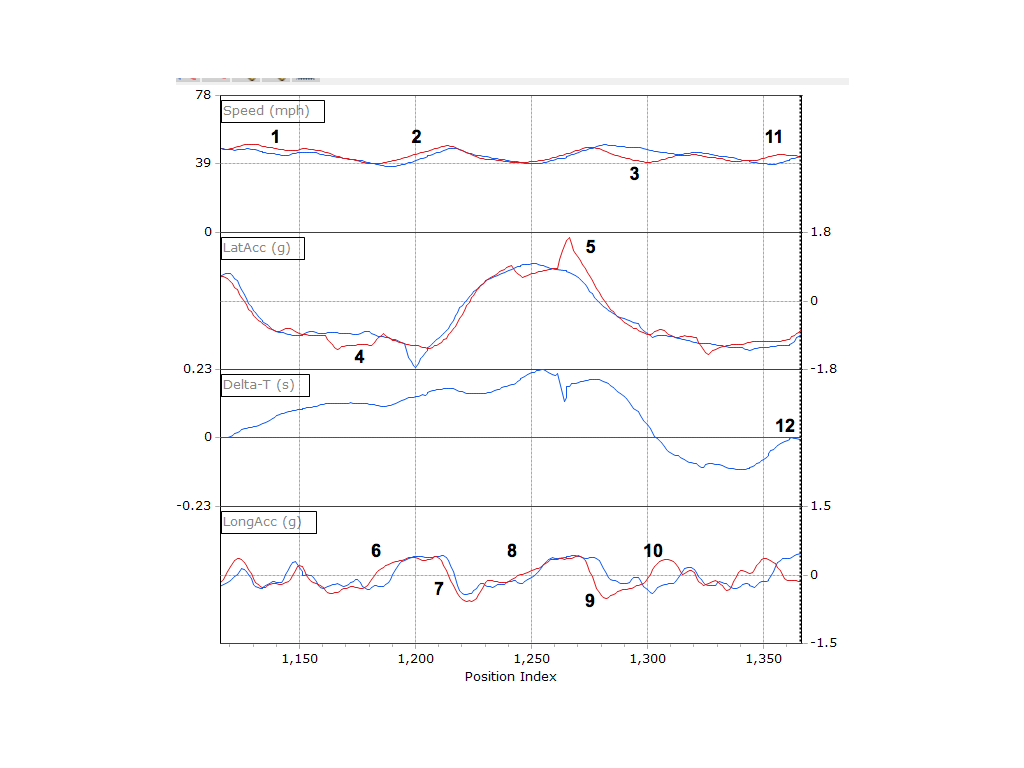
Fig. 4 Graph w/ Indicator Numbers
I can’t rescale the graphs, so at number 1 the speed difference might not look like much but red is actually 3 mph faster entering the first turn at the start of the segment. At 2 red is exiting the first turn and is now 3.6 mph faster.
Unfortunately, at 3 we can see that the red run has had a problem. Red is now 8 mph slower than blue. We need to figure out what the heck happened.
If we go down to the lateral acceleration graph, we can see at 4 that red is cornering harder. This has to be the case, right? If you look at Fig. 2 the red and blue tracks are identical going around that first corner, but we know that red is going faster. Therefore, red must be pulling more lateral g’s. Maybe there was a little more grip, but I think I was just driving harder. I was mad after screwing up the showcase turn (see Part 2) and desperately trying to catch up, knowing I needed a faster run to stay at the top of the class. The Delta-T graph shows blue consistently losing time to red during the first half of this segment.
At 5 disaster strikes. Huge spike in lateral g’s. The backend of the car has slid out in oversteer. Just before the spike the LatAcc goes down. That’s the loss of grip. The spike is the tires violently regaining grip. The kink in the red GPS track is the very quick change of direction of travel. Same thing, right? Can’t be a quick change in direction without a lateral G spike. Unless a locomotive hits you!
But, before we analyze what happens at 5, go on to 6 and see that red gets on the gas much earlier than blue coming out of the first corner. This is what produces the speed increase at 2. The delta-T starts climbing even steeper in favor of red, showing how much it pays to be on the throttle early when exiting a corner.
Because red is going faster I brake earlier and harder on the red run at 7 for the next corner. Maybe a little too hard, but it seems to pay off at 8 where red is now going faster in the crossover point between corners where the lateral g is near zero, i.e. the car is not turning at all. This is right at the peak Delta-T advantage for the red run, about .23 seconds on the Delta-T graph at the 1,250 foot position.
The spike in LatAcc at 5 is an effect that can sometimes be used to advantage, but when it occurs in the middle of a sweeper it’s almost always bad. Notice that immediately after at 9 the LongAcc has gone negative. I’ve had to get out of the gas and slow the car (see indicator 3) in order to regain control and prevent a spin. The delta-T advantage for run 3 starts dropping like a rock after 5 and keeps dropping. The red run goes from a .23 second advantage to a .11 second loss before it turns around again. On the video, all you see is a correction I make at the steering wheel just after the 1:05 mark. It looks like almost nothing, but the data says over 3 tenths in total. Part of the time loss (~0.12s) is the wider arc I was forced to take after that point, which you can see from the GPS track. The extra distance was seven feet and at 40 mph that takes .12 seconds, if I’m doing the math right.
At 10 the positive LongAcc indicates I’m desperately trying to regain the speed lost earlier. Finally, by 11 the red speed is higher than blue by 5 mph and the Delta-T becomes zero at 12. All that good driving early in the segment for nothing.
So, what’s the lesson I learned from this and from the similar problem described in Part 2? Losing the rear end in a big way is really, really bad. The time loss can be huge. I had stiffened my rear shocks for Day 1 and it was a mistake. On Day 2 I set them back a little softer and I had no more problems like this. My take is that it is much better for me, at least at my present level, to have a slightly pushy car than the opposite.
