This is part 1 of a series that will look at basic autocross data crunching, using data from my car at the Wilmington Champ Tour last weekend. First up: the big sweeper on Day 1.

The Mile-Long Wilmington Day 1 Course
The picture above is the whole track from start (lower left) to finish as recorded by a Vbox Sport with 20Hz GPS. Two runs are shown, Run 1 in blue and Run 3 in red. Run 3 was only 0.135 seconds faster than Run 1 overall, but that was enough to move me from 2nd to 1st for the day. What I found by looking at the data was that there were huge swings in time between the two runs. In other words, mistakes in Run 1 were being offset by better driving in Run 3, but then a mistake in Run 3 would knock it back down again. (Run 2 was mostly a running disaster. I don’t want to talk about it!)
This post will be fairly technical. That’s just the way it is. I’m convinced that most folks can’t get fast in autocross fast without learning from data. It’s really not that hard. It just takes some effort and the money for the electronics, of course. In my case, being Apple people at home, I had to purchase a PC because the V-box software, even though free, only runs on Windows. (I got the cheapest laptop money could buy.)
The dots in the picture above show where I divided the tracks into eight segments. The segment time data is shown below.

Segment Data: S1 = Segment 1, etc.
Run (Lap) 3 is the top line and is set as the baseline, so the total time for each segment is shown. You can see 6.09 seconds for S3, for instance. The total time shown (01:15.89 or 75.89 seconds for Run 3) is never going to be exactly right, since I cannot exactly set the start and finish positions. Below the baseline times are delta times. So, Run 2’s delta from Run 3 in S3 is -00.00 seconds (nothing) and Run 1 has a delta of +00.24 seconds. Run 3 was a quarter of a second faster than Run 1 in segment 3.
Comparing Run 1 to Run 3, Run 1 was faster (negative numbers) in three segments, Run 3 was faster in three segments, and one segment (S2) was dead even. Run 3 without the new mistakes not made in Run 1 would have been .25 + .15 + .22 = a whopping .62 seconds faster. Putting the best segments together like this shows you just how much improvement is theoretically possible right now without having to learn to drive any better than you’ve already proven you can.
We will focus on S3 which contains the big sweeper. According to the data above, S3 took 6.09 seconds in Run 3. Run 2 was dead even with Run 3. Run 1 was 0.24 seconds positive, or slower, than Runs 2 and 3. If you look at the figure below, you can see why. The blue track is Run 1, the red is Run 3.
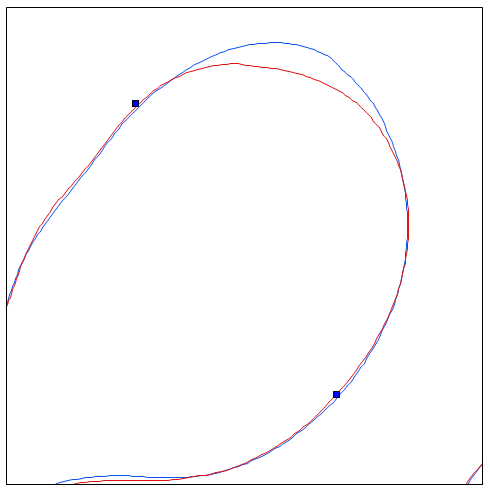
Big Sweeper Tracks – Segment 3
In Run 1 (blue) the car (the car, not me!) pushed out big-time on the turn-in to the big sweeper. I wonder why it did that?
First of all, you need to know that my attitude was that I intended that first run to win the class for the day. It was a no-holds-barred, aggressive as heck, fast as I could go run. I felt like I had spent the necessary time walking, studying pictures and mentally practicing to really know this very difficult course for that first run. I was hoping that a blazing fast first run, no matter how sloppy, would demoralize the others. Maybe it did. I think it turned out to be the 3rd fastest time of the day in BS, beat only by my own 3rd run and Greg Vincent’s second.
That first run was definitely not a thing of beauty. You can watch the video of it here. The car enters the big sweeper 25 seconds into the video. You can see (and hear) what happens and how quickly it happens. Basically, I jerk the wheel right and the car immediately pushes, i.e. it doesn’t do much turning. All you can do then is to let the car scrub off some speed and turn the steering wheel back toward center until the front tires grip again. (Later, at about 35 seconds, I nearly lose it completely. I think that’s when the right side of the seat-back gave way, as it tends to do.)
One last chart will give more insight into the key differences. The figure below is the speed and lateral acceleration (in g’s) plot with respect to position (distance from the start) for S3. Again, red is Run 3, blue is Run 1.

Velocity & Lateral G w/r/t Position for Segment 3
First, look just left of the vertical dotted cursor line and see how the speed of Run 3, the red line, starts dropping earlier than the blue line. That blue speed line is me entering the sweeper too fast, at almost 57 mph, having lifted/braked too late. By Run 3 I know better and enter at 52 mph. In Run 1, in order to get back on line, I then had to slow the car (blue line) to a 36 mph minimum, while at the same point the red line is showing 46 mph, 10 mph faster in the middle of the corner. On average, the blue line is about 0.3 mph faster than the red in this section. But, how much good do you think it does to go fast in the wrong direction?
What about distance traveled? This data is also available. The blue path is a very significant 20 feet longer than the red path in segment 3.
The lateral acceleration plot on the bottom is interesting because of how much smoother the red line is than the blue. The blue is choppy and inconsistent as the front end pushes out and I bring it back. See the deficient g-level for the blue line at the 400 foot mark? That’s in the middle of the push. Run 3 at the same point is turning much harder, i.e. further away from the zero-g centerline of the graph. As I fix the push the g-level of the blue line spikes downward to more than 1.2 g’s, but then comes back up again above the red line. The red line is consistent at more than 1.1 g’s. At the 450 foot point it is over 1.2 g’s.
This segment is also an example of what we discussed in this earlier post where we talked about time saved with a smaller radius in turn-arounds. On the first run I pushed out, creating a bigger radius.
Next up: Part 2 – How to really mess up the showcase turn!

Very nice bloog you have here
LikeLike